


AI Satellite Forecast
AI Satellite Forecast
From satellite data to more targeted fieldwork
Predicts relative weed pressure 1–2 years ahead
Divides fields into low-, medium-, and high-risk zones
Can be used for variable-rate application and field planning
Predict field variability before the season begins
Many farmers and agronomists know the feeling: Weeds often appear in the same places in a field year after year.
That experience helped inspire the satellite forecast. If weeds keep coming back in the same places, can we use those patterns to predict where they will appear next?
This was the starting point for developing the satellite forecast, which has since been tested in collaboration with Bayer, with promising results. At Frandsbjerg Agro, the module has also shown how the forecasts can be put to practical use, delivering significant savings.
HOW IT WORKS
From historical satellite data to forecast zones
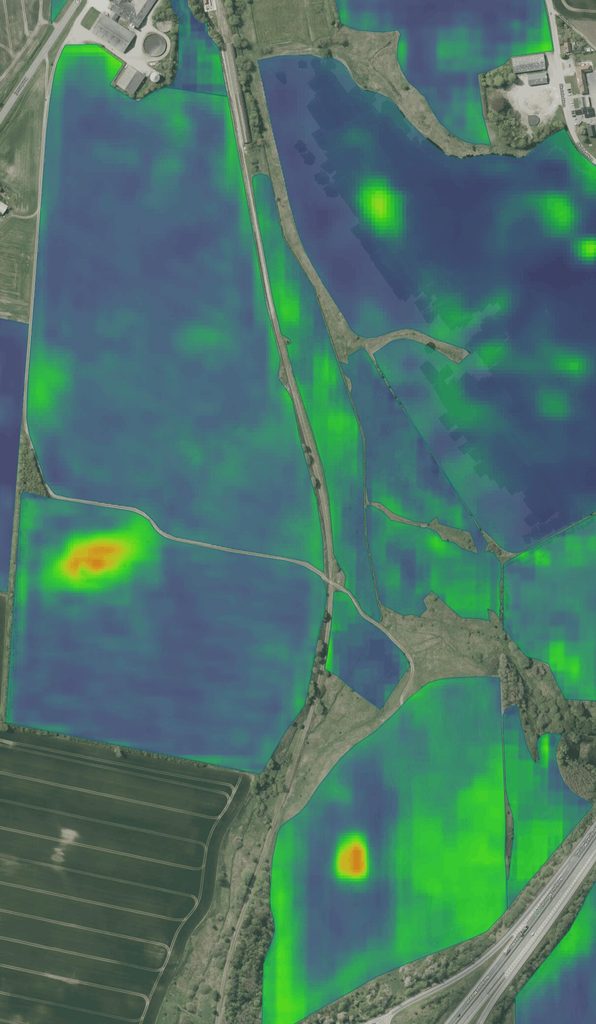
CropUp analyzes historical multispectral satellite imagery to identify patterns in fields and predict relative weed pressure 1–2 years ahead.
The model was developed using insights from more than 30,000 hectares of high-resolution, drone-based weed maps.
The output shows areas with:
LOWER
Relatively low expected weed pressure
MEDIUM
Medium expected weed pressure
HIGHER
Relatively high expected weed pressure
It does not predict the exact number of weeds that will emerge.
Instead, it provides a relative picture of how pressure is expected to vary across the field.
This relative variation can then be used to create management zones, support variable-rate application, and inform planning.
WHEN DOES IT MAKE SENSE?
When you want to plan ahead of the season
The satellite forecast provides insight into field variability before weeds become visible. It can support decisions about field scouting, weed mapping, and treatment planning.
POTENTIAL USES
How you can use the forecast
- Prioritize field scouting
- Identify areas that deserve extra attention
- Assess where drone-based weed mapping can deliver the most value
- Plan weed control earlier
- Compare expected pressure with what is later observed in the field
FIELD EXPERIENCE
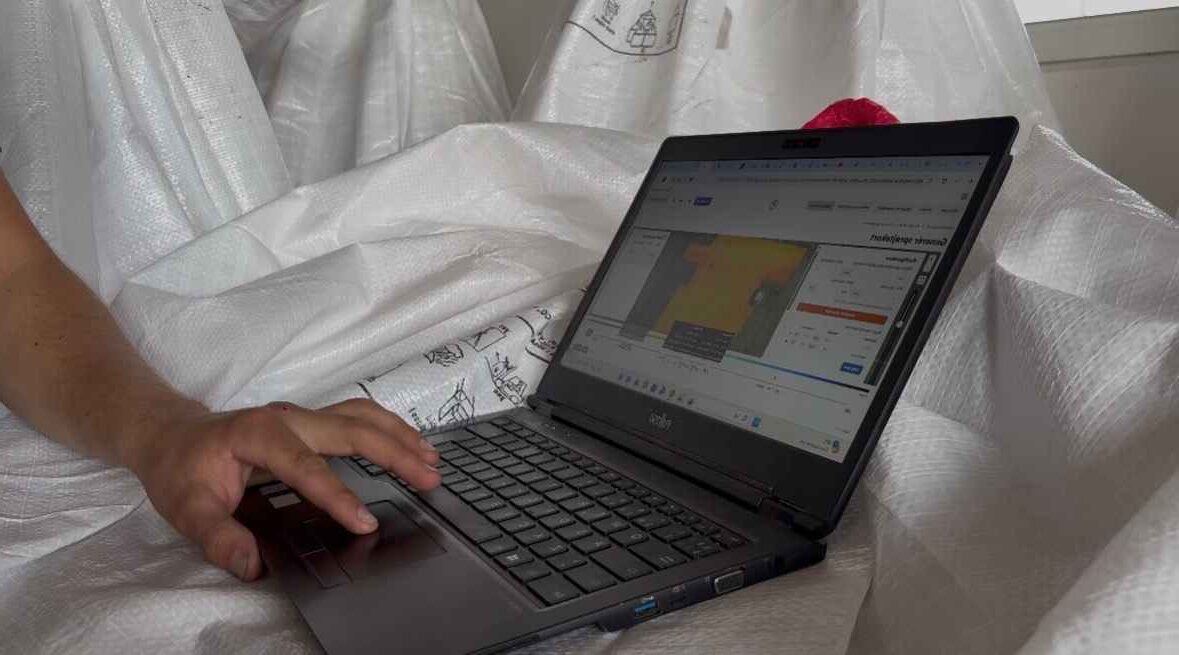
How Frandsbjerg Agro saved DKK 11.000 EUR in one season
Read the full case study here
SEE IT IN PRACTICE
See how AI Satellite Forecast works in practice
Tested in collaboration with Bayer
Does the forecast match reality?
An important part of developing the module has been comparing the predicted patterns with what is subsequently observed in the field.
Together with Stig Andersen and Søren Lykkegaard Hansen from Bayer Denmark, CropUp compared predicted low-, medium-, and high-pressure areas with field observations on two trial farms.
The early results showed strong qualitative agreement.
Areas predicted to have relatively higher weed pressure consistently showed more weed pressure in the field than areas predicted to have lower pressure.
The results are still preliminary and should not be considered broad scientific validation, but they offer a promising indication that historical satellite imagery can contain useful information about future weed pressure patterns.
GET STARTED
Try the satellite forecast on up to 3 fields – completely free
FAQ
Frequently asked questions
We already have a system that creates satellite-based application maps. How is CropUp different?
Many solutions use satellite imagery to show biomass and vegetation indices such as NDVI. This provides a good overview of field variability.
CropUp Satellite goes a step further by using AI and historical satellite data from the past five years to analyze patterns and variations in fields.
The goal is to turn this information into practical, machine-readable application maps for variable-rate crop protection using products such as herbicides, fungicides, and plant growth regulators.
The difference, then, is not in the satellite imagery itself, but in how the data is analyzed and translated into a specific spraying task.
How can CropUp create precise spray maps using old satellite imagery?
This is one of the questions we get most often.
CropUp Satellite uses historical satellite imagery to identify recurring patterns and variations in the field.
Many differences within a field remain relatively stable over time. They may be caused by soil conditions, water availability, and other local growing conditions.
By analyzing satellite data from multiple years, we can identify these patterns rather than basing the analysis solely on a single current satellite image.
However, this does not mean we can see exactly what the field looks like today. The analysis is a prediction based on historical data, not a direct observation of current conditions.
That is why it is also important for the farmer to assess the map in light of current field conditions.
How accurate is CropUp Satellite?
CropUp Satellite has a spatial resolution of 10 × 10 meters.
This means each cell represents 100 m² of the field.
100 m² = 0.01 hectares (ha).
This means that one hectare contains 100 cells measuring 10 × 10 meters, which is the resolution of CropUp Satellite.
It is important to distinguish between spatial resolution and the accuracy of the agronomic recommendation.
A resolution of 10 meters does not mean CropUp can identify individual weeds or guarantee that the need for crop protection is the same throughout the entire cell.
Satellite is designed for variable-rate treatment at the field level, while CropUp Drone can be used for much more detailed mapping and spot spraying.
Can CropUp Satellite identify weeds and different weed species?
CropUp Satellite does not identify individual weeds or specific weed species.
The model uses historical satellite data and AI to predict variations in factors such as weed pressure.
It is therefore important to understand the difference between the two CropUp solutions:
- CropUp Satellite – Predicts variations and creates maps for variable-rate treatment.
- CropUp Drone – Image-based weed detection at a higher level of spatial detail, where image quality, crop, and growth stage allow.